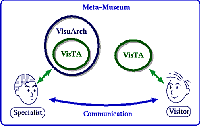
Figure 1. Communication model between experts and museum visitors
VisTA: An Interactive Visualization Tool for Archaeological Data
Rieko Kadobayashi, Eduardo Neeter, Kenji Mase, Ryohei Nakatsu
Abstract - VisTA is an interactive visualization and simulation tool for archaeological and geographical data. The goal of the system is to support archaeologists in their work of forming and discovering knowledge on the evolution of ancient villages. Users of the system can visualize ancient villages, using 3D Computer Graphics, simulate the transition of a village over time, as well as the lifespan of each house. VisTA also allows users to walk through villages, greatly helping archaeologists study the spatial and geographical layouts of the villages. For museum exhibitions, we developed VisTA-walk which allows users to walk-through reconstructed villages and get information through gesture interaction.
< previous paper | section details | next paper >
We have proposed the concept of the Meta-Museum (Kadobayashi and Mase 1995, Mase et al 1996), which is a supportive environment for knowledge sharing between experts and non-experts. Here, the experts are archaeologists and museum staff members, and the non-experts are museum visitors.
Meta-Museum is also an integrated environment of traditional museums and a virtual museum. Traditional museums have many rich and real artifacts and have accumulated knowledge about them, i.e., the continuous study of experts. These objects and knowledge are open to museum visitors via exhibitions, which can be considered as one of the possible organizations of some portions of knowledge based on the expert interest. The virtual museum is the fruit of recent multimedia, digital and networking technologies. It provides very handy archived information compared to the traditional museums.
In either museums, exhibitions are usually designed for general visitors who generally are quite diverse in their interests and base knowledge. This causes a problem in that what the experts want to relate to the visitors differs from what the visitors want to know. In order to solve this problem, we need to create a two-way flow of information between experts and non-experts so that they can exchange their knowledge and interests, which might differ depending on their backgrounds. Meta-Museum aims to provide environment tools to create and facilitate communication between experts and non-experts.
VisTA (Kadobayashi et al 1996) is one of such tools and the first experimental system in the Meta-Museum project. VisTA was originally designed as an interactive simulation system for the development of research into ancient villages. It was then extended as a bridge between experts and non-experts in the sense that both could use it for different purposes.
VisTA has three objectives: the first is to provide archaeologists with a new tool for setting up and testing hypotheses about the evolution of ancient villages, thus making it easier to treat spatiotemporal data. The second is to help archaeologists present their research results easily. The last is to provide non-experts with a better understanding through the visual representation of complicated data.
The following functions are available in the system: users can set each building's life span, simulate the change of the village over time interactively and graphically, retrieve information on each building via a web browser, and walk through the visualized village.
The rest of this paper is organized as follows. Section 2 provides an overview of the VisTA system. In section 3, the process of excavated site reconstruction is discussed. Section 4 reports the exhibition where the VisTA system is displayed and section 5 describes VisTA-walk. Section 6 concludes this paper.
Figure 1 shows the position of VisTA in Meta-Museum. VisTA is a subsystem of VisuArch, which is a research tool for experts to study ancient villages in detail and is under development. In order to facilitate communications between experts and non-experts, we extract some of the functions of VisuArch and package them as the VisTA system.
Figure 1. Communication model between experts and
museum visitors
The users of VisTA can walk-through reconstructed villages to see their landscapes and get information on each house as well as see the development of a village over time. Hence, VisTA is regarded as common ground where both experts and non-experts can exchange knowledge and query each other.
Initiating the VisTA system, a user first chooses one database of an excavated site. This database includes 3D terrain data of the site and data on the positions, sizes, and types of buildings.
To indicate the positions of buildings, the system displays floor marks which correspond to the floor shapes of the buildings. The user picks floor marks one by one and for each, inputs the building type, terms of existence, and identification name. By doing this process on all or some of the floor marks in the village, the user can simulate the transition of the village over time and check his/her hypotheses through 3D computer graphics. If the user thinks his/her hypotheses are wrong, the user can modify the input data again and again until reaching a satisfactory conclusion. This is how users can make and test their hypotheses about the development of a village over time and get new knowledge. These functions can be controlled with a graphical user interface (GUI). Figure 2 shows a snapshot of the VisTA system console.
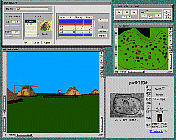
Figure 2. Snapshot of the VisTA system
Users can also "walk around" a reconstructed village and see the structures in a house while simulating the development of the village in a particular year. This allows the users to investigate the view from any point in the village.
The VisTA system has two types of windows, i.e., control windows and viewer windows. The following sections explain the details of the windows.
The viewer windows provide images of the village from particular positions at particular times during simulations. The viewer windows are interfaces for "walking-through" the village. The primary actions in the windows are to go forward or backward, and to turn left or right.
The interface between the user and the virtual world is provided by two different viewers. The first viewer, called the "Walk Viewer" (Fig. 2, bottom left), gives a perspective scene from a human model and as such is the "user's viewpoint." The second viewer, called the "Auxiliary Viewer (Aux Viewer)" (Fig. 2, middle right) provides a bird's eye view of the scene. In the "Aux Viewer", a human model (i.e., the avatar of the user) is also shown. This avatar is used as the reference of the current position and the size of the site or building.
This avatar is designed as a human model with a height of 170 centimeters. A scene is generated in the Walk Viewer using the coordinates of the avatar's eyes. Figure 3 shows a scene of the user in a house. The Walk Viewer displays only the inside of the house, while the Aux Viewer shows the avatar which helps the user know the size of the house intuitively.
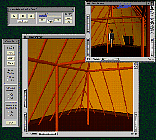
Figure 3. Scene of the inside of a house
The VisTA system is mainly controlled with the "Simulation Control Panel" window. Temporal transition simulation can be done with a panel of pict buttons like with a VTR. In addition, the "Preference" window and "Editing" window pop up if the user needs to set the simulation speed and duration parameters or modify the data of each building. The "Console" window is the interface for the input/output of files and for specifying the parameters of the display.
The Simulation Control Panel (Fig. 4, top right) has three parts. The buttons of the left part are for operating the simulations. The buttons of the upper part are used to play, pause, and stop the simulated development of a village. The buttons of the lower part are used to skip to a significant year, e.g., when events such as the construction or destruction of houses occur. The user can view a scene of the past with the left button and go ahead in time with the right button.
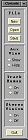
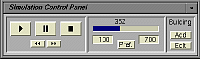
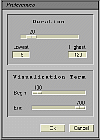
Figure 4. All of the
control windows
The middle part of the Simulation Control Panel is to set the duration of a simulation and display the year currently shown in the viewer window. For example, in Fig. 4, the user is simulating the transition of a village from A. D. 100 to A. D. 700 and the simulated view of the village in A. D. 352 is shown in the viewer window.
The right part of the panel is to edit the data of buildings. Building a house is done by specifying the type of building at each floor mark. For example, to add a new building, the user first selects a floor mark. The user then pushes the "Add" button to pop up the "New Building" window as shown in Fig. 5, to input the identification name, lifespan and type of building.
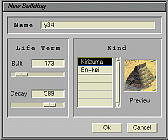
Figure 5. Window for adding new buildings
When the user wants to modify the data of an existing building, the user first pushes the "Edit" button to pop up the "Edit Building" window and then inputs new values. The "Edit Building" window has a delete button, and is different from the "New Building" window. If the user clicks the "Edit" button without specifying a building, a list window pops up as shown in Fig. 6. The user can select a building and modify the data of the building.
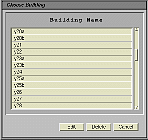
Figure 6. Window for listing buildings
When the user completes the data registration and/or modification after repeating the job mentioned above and setting the lifespan for each building, the user makes hypotheses about the transition of the village over time. Figure 7 shows snapshots of a simulation of a hypothesis. We can see that the distribution of buildings in a village changes over time.

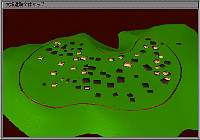
Figure 7. Example
sequence of a simulation: The site of Otsuka in B.C.45, B.C.24 and A.D.1
The "Console" window (Fig. 2, left) contains the system controls. It has four sections and one "Quit" button. The first section relates to the management of "Files." The second one controls the display of the "Aux Viewer," the third one controls the "Track Human" functionality, and the fourth one controls the "Stereo Vision". The "Aux Viewer" window provides a bird's eye view of a whole village so that the user can see where she/he is currently walking. The "Track Human" functionality makes the virtual camera of the "Aux Viewer" follow the model of the virtual human as it moves in the scene. The virtual human represents the user's position in the village being simulated and the camera position to create the viewer scene. If the "Stereo Vision" is set "On", the VisTA system displays a 3D image on the viewers. The user can view stereo-scopic images by using "Crystal Eyes" stereo viewer glasses.
We selected the site of Otsuka (Yokohama-shi 1991) in Yokohama, Japan as an experimental site. This site was in existence in the Yayoi era, which continued for about 600 years from about 2,300 years ago and is a very interesting period for archaeologists because they think ancient Japanese villages began to form cities at this time. Otsuka is a typical example of a village of this era, being surrounded by a ditch about 2 meters deep with a barrier about 1.5 meters high. We can easily get a contour map of the site as the excavation reports have been published. In addition, each floor has been clearly detected and the data on the position, size, and shape of each floor is also easily accessible.
There are four types of models constructed for simulation: land, floor marks, buildings, and a human. These models excluding the human model were created based on data included in various reports.
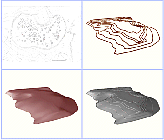
The land model consists of the terrain of the site and the sky above the virtual village. First, we input contour data obtained from a contour map like that shown in Fig. 8 (top left) and make a 3-D contour map (Fig. 8, top right). This 3-D contour map is then complemented with a surface to create a real terrain model (Fig. 8, bottom left). The sky is modeled as a texture-mapped cylinder object with a cone top, which is independent of the archaeological data but is used to provide an environmental scene.
Second, we put floor marks, each of which has a rectangular shape, to indicate the position, direction, and size of the floor of the building on it (Fig. 8, bottom right). At this point, the 3-D modeling of the surveyed area is accomplished and the fundamental database of the site is ready for archaeologists to build their hypotheses on it.
Next, buildings are modeled for archaeologists to set up their own hypotheses and evaluate them with VisTA. Two different kinds of structures are modeled: houses and warehouses. Both of them have three different levels of detail models in order to achieve quick responses in interactions with the viewers. The system automatically chooses a detail model of the appropriate based on the apparent size of the building in the viewer.
Each kind of building needs its own kind of floor mark. For this reason, two different floor models are incorporated. The buildings are set on the floor marks and automatically scaled to proper sizes according to the sizes of the floor marks.
We displayed the VisTA system at the Ori-Amu Museum in Osaka in a museum exhibition from November 4 to December 3, 1996 to evaluate the effectiveness of the system for non-experts. Figure 9 shows a snapshot from the exhibition.
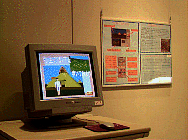
Figure 9. VisTA system displayed at the Ori-Amu
Museum
The expected users were the general public who may not have had archaeological knowledge as well as children. For non-experts, we arranged another version which differed from VisTA in terms of the functions and user interface. The clear distinction was the hiding of functions to set up and evaluate different hypotheses since this version was to be used as a system for easily understanding archaeological results. In other words, users could not set and/or modify the value of each building, while they could simulate the temporal development, walk through the village, and get data of the Otsuka site.
As for the user interface, this version provided only a mouse as the input device to let users concentrate on experiencing the contents. The GUI of VisTA designed for the exhibition is shown in Fig. 10. Information on selected buildings is provided via a web browser as shown in Fig. 10 (bottom right). This method makes it easy to get other detailed information, e.g., the description of the Otsuka site, and access to the wide variety of information related to the site through the Internet.
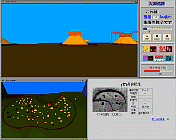
Figure 10. User interface of VisTA in a museum
We handed out questionnaires on VisTA system and obtained eighty seven replies during the exhibition. The questionnaires contained twelve questions, each of which was to be given one of five grades, e.g., the user's interest in archaeology, his/her familiarity with PCs, the ease of use of the system, etc., and a free description about the system.
More than 90% of the visitors who replied answered that they had an interest in archaeology. The number of PC users was almost equal to the number of non-users. About 75% of these visitors answered that they were interested in the VisTA system. As for the ease of use of the system, the percentages of visitors who answered 'easy', 'average' and 'difficult' were 33%, 26%, and 41%, respectively. More than 80% answered that the VisTA system was useful for obtaining a better understanding and more than 90% answered that they wanted to try to use systems like VisTA in other exhibitions.
We obtained a significant correlation on the ease of use between visitors familiar with PCs and visitors not familiar with them. That is, the percentage of visitors who answered VisTA was easy to use was high in the former group while the percentage of visitors who answered VisTA was difficult to use was high in the latter group. However, there was no significant difference between these two groups concerning the question of whether they wanted to use VisTA again. We could conclude that the user interface is especially difficult for those unfamiliar with PCs and should be improved, while it greatly helped visitors understand the contents of the exhibition.
As the questionnaire survey indicated, the user interface of the VisTA system should be improved. Hence, we developed the VisTA-walk system which has a more intuitive interface, i.e., gesture-based interface, than the VisTA system. Figure 11 shows a block diagram of the VisTA-walk system.
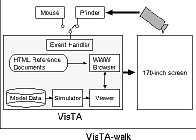
Figure 11. Block diagram of VisTA-walk
In this system, the gesture recognition subsystem, pfinder (Wren et al 1997), is used to recognize the user's gestures. Pfinder receives the images captured by the camera set on top of the screen and outputs the position of the user's head, hands, body, and feet. These outputs are interpreted as commands to walk-through the village and point out buildings (Kadobyashi and Mase 1998).
We apply steering wheel-like control to map gestures to walk-through commands. The actions of stepping forward or backward are translated to the actions of moving forward or backward in visualized village steps. Likewise, stepping right or left is mapped to turning right or left. To stop at a desired point, the user must go back to the neutral position.
Pointing at a building is done by raising the right or left hand. If a user raises his/her right hand, the building which is closest to the center of the screen and located on the right part of the screen is selected. Similarly, if the user raises his/her left hand, the building closest to the center of the screen and located on the left part of the screen is selected.
In addition to these gesture interactions, we employ two more gestures to control the view position. Raising both hands corresponds to looking up at the ceiling or the sky while squatting down corresponds to looking straight from lower position.
An example use of VisTA-walk is shown in Fig. 12. The user is raising her left hand to select a building in order to show the reference data of the building in the top right window.
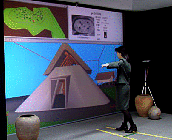
Figure 12. Snapshot of the VisTA-walk system
We have briefly described the VisTA system as one of the sub-projects and testbeds of the Meta-Museum project. The VisTA system provides functions to interactively visualize simulation of temporal changes of ancient villages, based on archaeological data obtained from the excavations to date.
This tool supports archaeologists in the formulation and evaluation of hypotheses about the formation process of ancient villages. Using 3D computer graphics and village evolution simulation, the user can iterate over the hypothesis development process and perceive village evolution in novel ways. In addition, the user can interact with the system and adjust parameters on-the-fly following "what if" investigations.
In the case of the Otsuka site, the excavation site has already been covered by land development. The data of this site was obtained 30 years ago. By using VisTA, archaeologists can today continue research about this site even geographically exploring new dimensions of knowledge.
We hope to observe how the communication process between experts and non-experts is going to be facilitated using a shared knowledge space. Also, by incorporating new features such as a comprehensive environment and CAD terrain representation in the archaeologist's tool box, new frontiers of research should be opened allowing the discovery of new knowledge.
The pfinder gesture recognition system used in the VisTA-walk system is provided by the Perceptual Computing Section, Media Laboratory, MIT. The authors would like to thank Mr. Yasuyoshi Sakai, the Chairman of the Board of ATR MI&C, and Dr. Ryohei Nakatsu, the President of ATR MI&C, for their support and encouragements in this research.